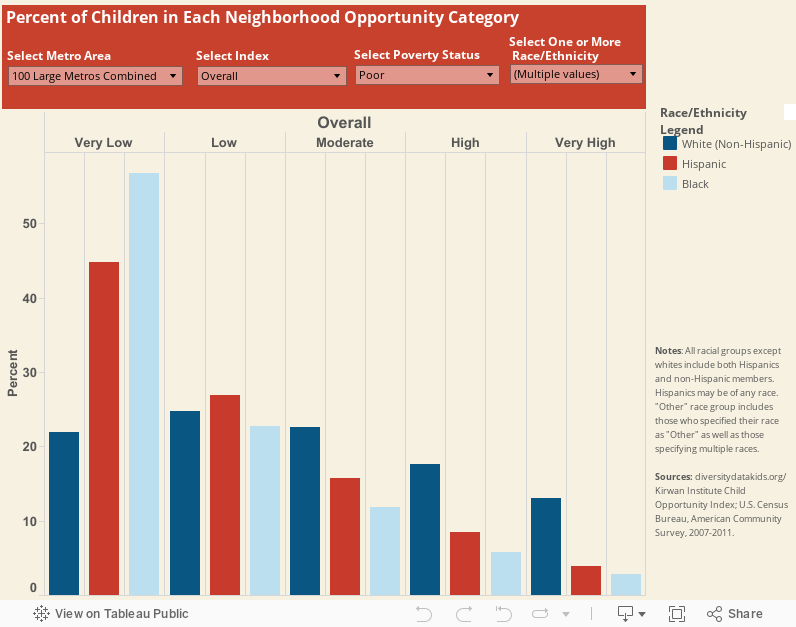
The Child Opportunity Index toolkit now includes interactive bar graphs that allow you to choose multiple racial/ethnic groups and explore the distribution of the poor and non-poor child population living in neighborhoods of varying opportunity levels. Select from among the 100 largest U.S. metropolitan areas or view data for the 100 largest metropolitan areas combined.