The quality of the neighborhoods where they grow up influences not only children’s experiences today but also how well they do as adults. Measures of adult wellbeing include, for example, life expectancy and socioeconomic mobility.
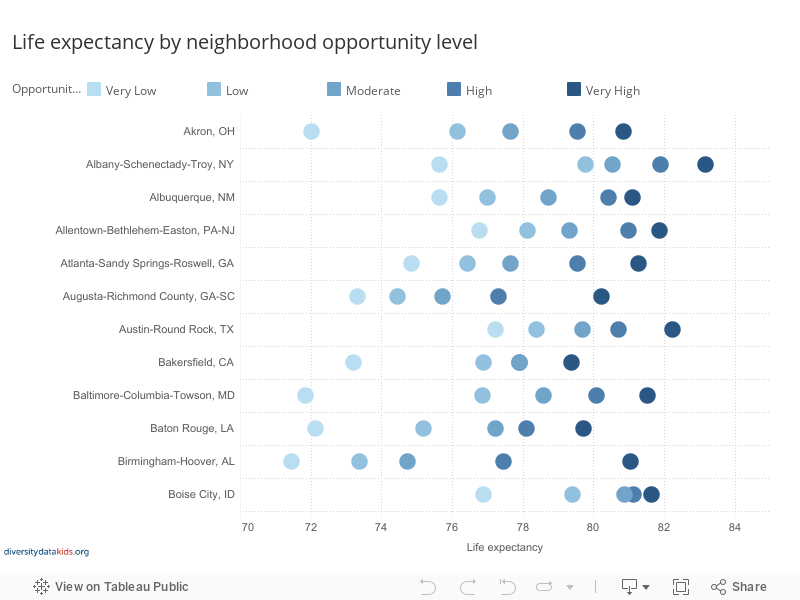
Very low- and very high-opportunity neighborhoods vary considerably not only in the conditions and resources they offer to children but also in the health and life prospects of their residents. Life expectancy at birth is a helpful way of summarizing the health of a population. It tells us how long people can expect to live when they are born.
Across the 100 largest metropolitan areas, life expectancy at birth is higher with every level of neighborhood opportunity.
Use the tool below to explore the difference in life expectancy between the five Child Opportunity Levels within each metro area.
The life expectancy gap
A summary measure of the health inequities between very low- and very high-opportunity neighborhoods is the magnitude of the gap in life expectancy between these two opportunity levels. On average, there is a difference of seven years in life expectancy between residents in very low-opportunity neighborhoods (life expectancy of 75) and residents in very high-opportunity neighborhoods (life expectancy of 82). This is the same difference in life expectancy that exists between Mexico (75) and Sweden (82).
The visualization below shows the extent to which inequity in life expectancy between very low- and very high-opportunity neighborhoods (life expectancy gap) varies by metro. Metros at the top of the visualization have the greatest inequity. As you scroll down, the magnitude of the gap in life expectancy narrows.
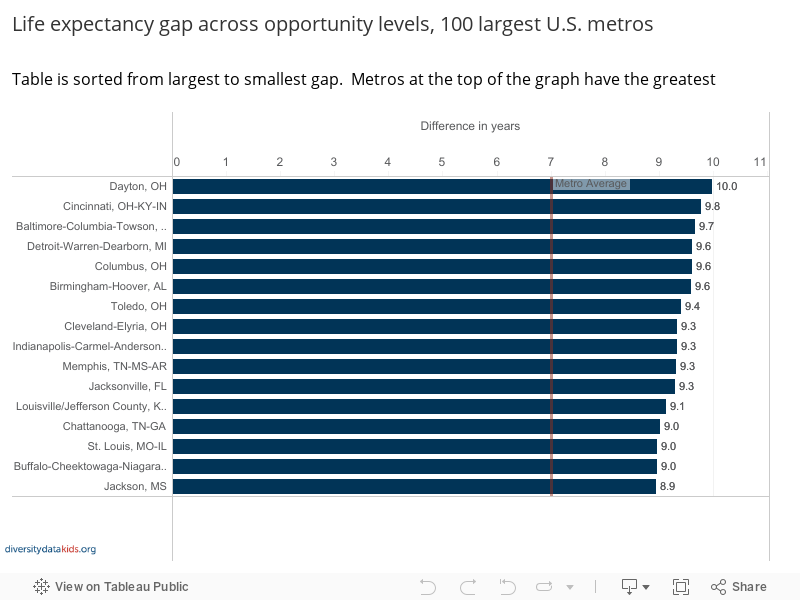
The life expectancy gaps shown above typically reflect the size of the Child Opportunity Gap in a given metro. In Detroit, which has a very large Opportunity Gap (93) between very low- and very high-opportunity neighborhoods, we observe a high life expectancy gap of 9.6 years. On the other hand, in San Jose, where the Opportunity Gap is relatively small (63), the life expectancy gap is small 3.3 years.
Child opportunity and socioeconomic mobility
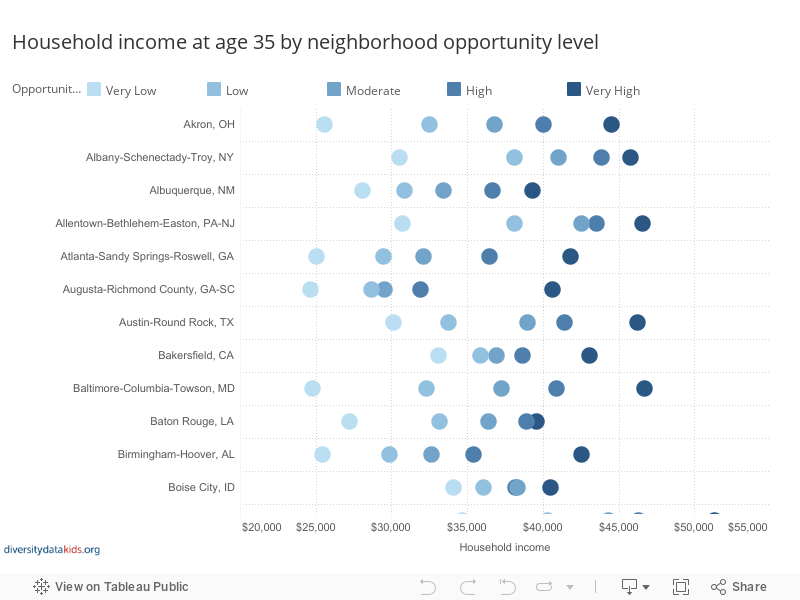
Child opportunity is also strongly associated with socioeconomic mobility: the socioeconomic standing of an adult compared to the socioeconomic standing of the family where she grew up. One measure of socioeconomic mobility is the household income attained at age 35 for a child growing up in a low-income family (defined as a family with an income at the 25th percentile of the parent income distribution).
The adult household income for children growing up in low-income families is higher with every level of neighborhood opportunity. This means that children from equally poor families could have very different adult incomes depending on the type of neighborhood they grew up in. The graph below shows the difference in socioeconomic mobility between the five levels of neighborhood opportunity within each metro area.
The socioeconomic mobility gap
A summary measure of the inequities in adult socioeconomic wellbeing between very low- and very high-opportunity neighborhoods is the magnitude of the gap in adult household income at age 35 between these two opportunity levels. On average, the income attained at age 35 for a child growing up in a low-income family (25th percentile of the income distribution) varies from $29,000 in very low-opportunity neighborhoods to $45,000 in very high opportunity neighborhoods. This means that two children from equally poor families could have very different adult incomes depending on the type of neighborhood they grew up in.
The visualization below shows how the extent of inequity in socioeconomic mobility between very low- and very high-opportunity neighborhoods (socioeconomic mobility gap) varies across metros. Metros at the top of the visualization have the greatest gap. As you scroll down, the magnitude of the gap in socioeconomic mobility narrows.
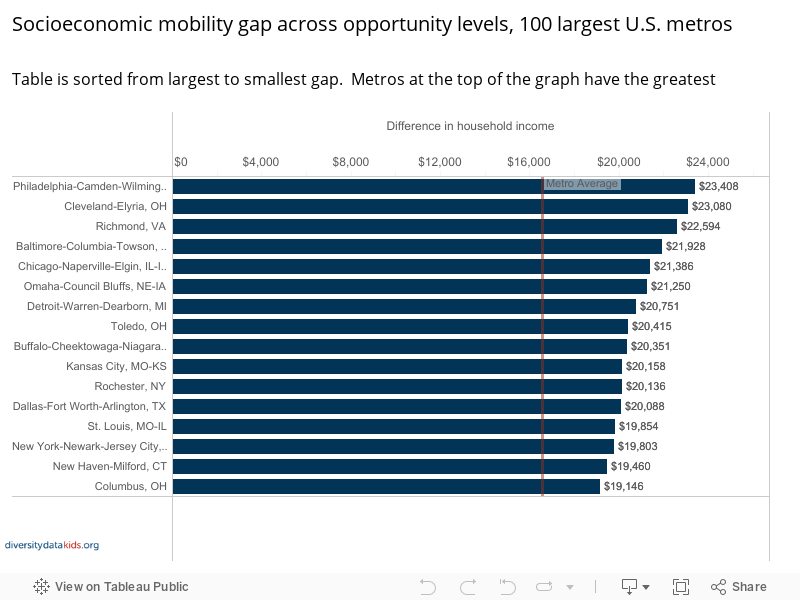
The socioeconomic mobility gaps shown above typically reflect the size of the Child Opportunity Gap in a given metro. Again Detroit, an area with a wide Opportunity Gap (93)—and a wide life expectancy gap—also has a wide socioeconomic mobility gap. There is a difference of $20,751 between very low- and very-high opportunity neighborhoods in household income at age 35 for children growing up at the 25% percentile of the parent income distribution. On the other hand, Portland, OR, an area with a relatively narrow Opportunity Gap (67), has a small socioeconomic mobility gap of $8,471.
Sources: Child Opportunity Index 2.0 database, diversitydatakids.org. The Opportunity Atlas, opportunityinsights.org. U.S. Small-area Life Expectancy Estimates Project (USALEEP), Centers for Disease Control and Prevention.
Note: A data revision in June, 2020 has led to very small changes in datapoints/rankings for some individual metros. See the revisions and updates page for complete details.