That children in Bakersfield, California and Boston, Massachusetts face very different opportunity should be a cause for concern. But perhaps more striking are the inequities in opportunity within metro areas. In many metro areas, the difference between their lowest and highest opportunity neighborhoods is as wide as the difference between very low- and very high-opportunity neighborhoods across the entire nation.
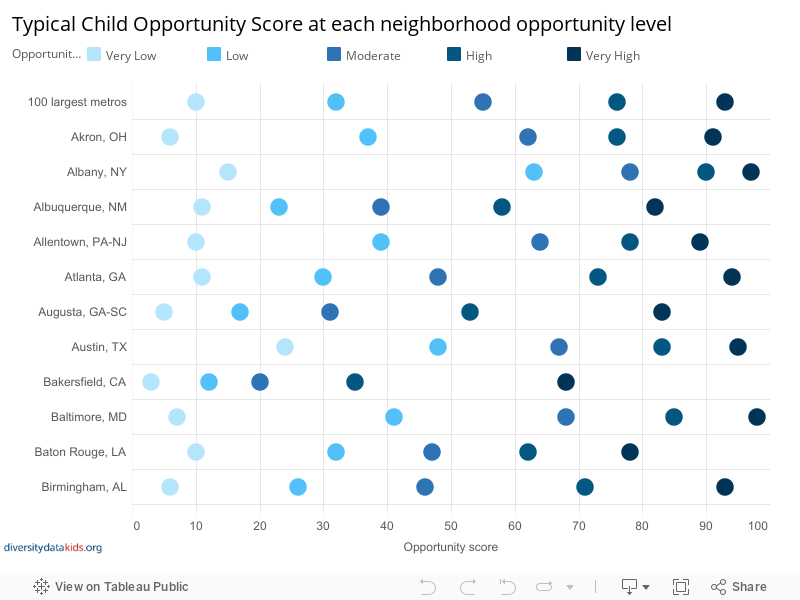
To measure the difference in conditions that children experience, we look at the Child Opportunity Score by opportunity level. This allows us to compare very low-opportunity neighborhoods between metro areas. A child living in a very low-opportunity neighborhood in Milwaukee with a score of only 4 experiences much worse conditions than a child in a very low-opportunity neighborhood in Austin with a score of 24.
Use the tool below to explore the wide variation in scores by opportunity level between metro areas.
The Child Opportunity Gap
The Child Opportunity Gap is the difference in median scores between very low- and very high-opportunity neighborhoods in a given metro. In some metros, the scores are very different, signaling that children have dramatically different chances depending on where they live.
Detroit, Michigan, has a Child Opportunity Score of 55—the same score as the 100 largest metros combined. However, the difference between neighborhoods with the lowest and highest Child Opportunity Scores in Detroit is 93 points. This means that two children in Detroit could live just a few miles apart in neighborhoods that offer vastly different opportunity. Often, within metros the geographic distance between neighborhoods is small, but the opportunity distance—the Child Opportunity Gap—is large.
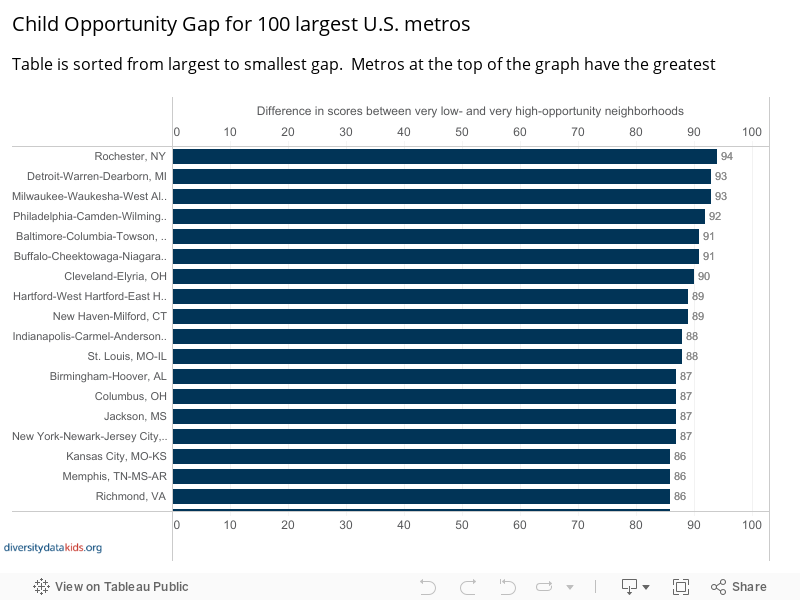
The graph below ranks metros based on the Child Opportunity Gap—the difference, in points, between the Child Opportunity Score for their very high- and their very low-opportunity neighborhoods.
The Child Opportunity Gap is a measure of the extent of inequity between neighborhoods: the wider the gap, the wider the difference in conditions for children in lower and higher opportunity neighborhoods. For example, there may be a very large difference in the poverty rate between lower and higher opportunity neighborhoods, or in the share of families that have access to healthy food.
Metro areas at the top of the graph have the widest gaps, or greatest inequities, between very low- and very high-opportunity neighborhoods. As you scroll down, the Child Opportunity Gap narrows.
Implications of the Child Opportunity Gap
The opportunity gap between very low- and very high-opportunity neighborhoods represents differences along important dimensions of neighborhood environment. The chart below shows the gap in selected COI indicators across the 100 largest metropolitan areas.
For example, 84% of children in very low-opportunity neighborhood schools need free or reduced-price lunch. In very high-opportunity neighborhoods only 22% of children do. This gap in school poverty rates has implications for children: Attending schools with a high proportion of low-income students is linked to lower educational achievement.
Access to green space is also vastly different. In very low-opportunity neighborhoods, almost half of children (48%) lack access to parks and playgrounds. In very high-opportunity neighborhoods, under a quarter of children (22%) have limited access to green space. Access to safe places to play and to nature are critical for children’s health and wellbeing.
Housing vacancy is another important indicator of neighborhood opportunity. Abandoned or dilapidated buildings invite crime and drug use and lower the value of the surrounding housing stock. Neighborhoods with lots of vacant buildings signal disinvestment and neglect to the children and families who live there. In very high-opportunity neighborhoods the vacancy rate is only 4%, but in very low opportunity-neighborhoods that rate is almost 3 times as high (11%).
Opportunity hoarding and sharing
It is remarkable that such high levels of inequity in neighborhood opportunity exists within relatively small geographic areas such as metros. This means that within a given metro children are experiencing two completely different worlds of neighborhood opportunity. Based on the existing research evidence, there is little doubt that these inequities in neighborhood conditions result in very different childhood experiences and outcomes - educational achievement, health, stress - and life trajectories for children, even if they live only a few miles apart.
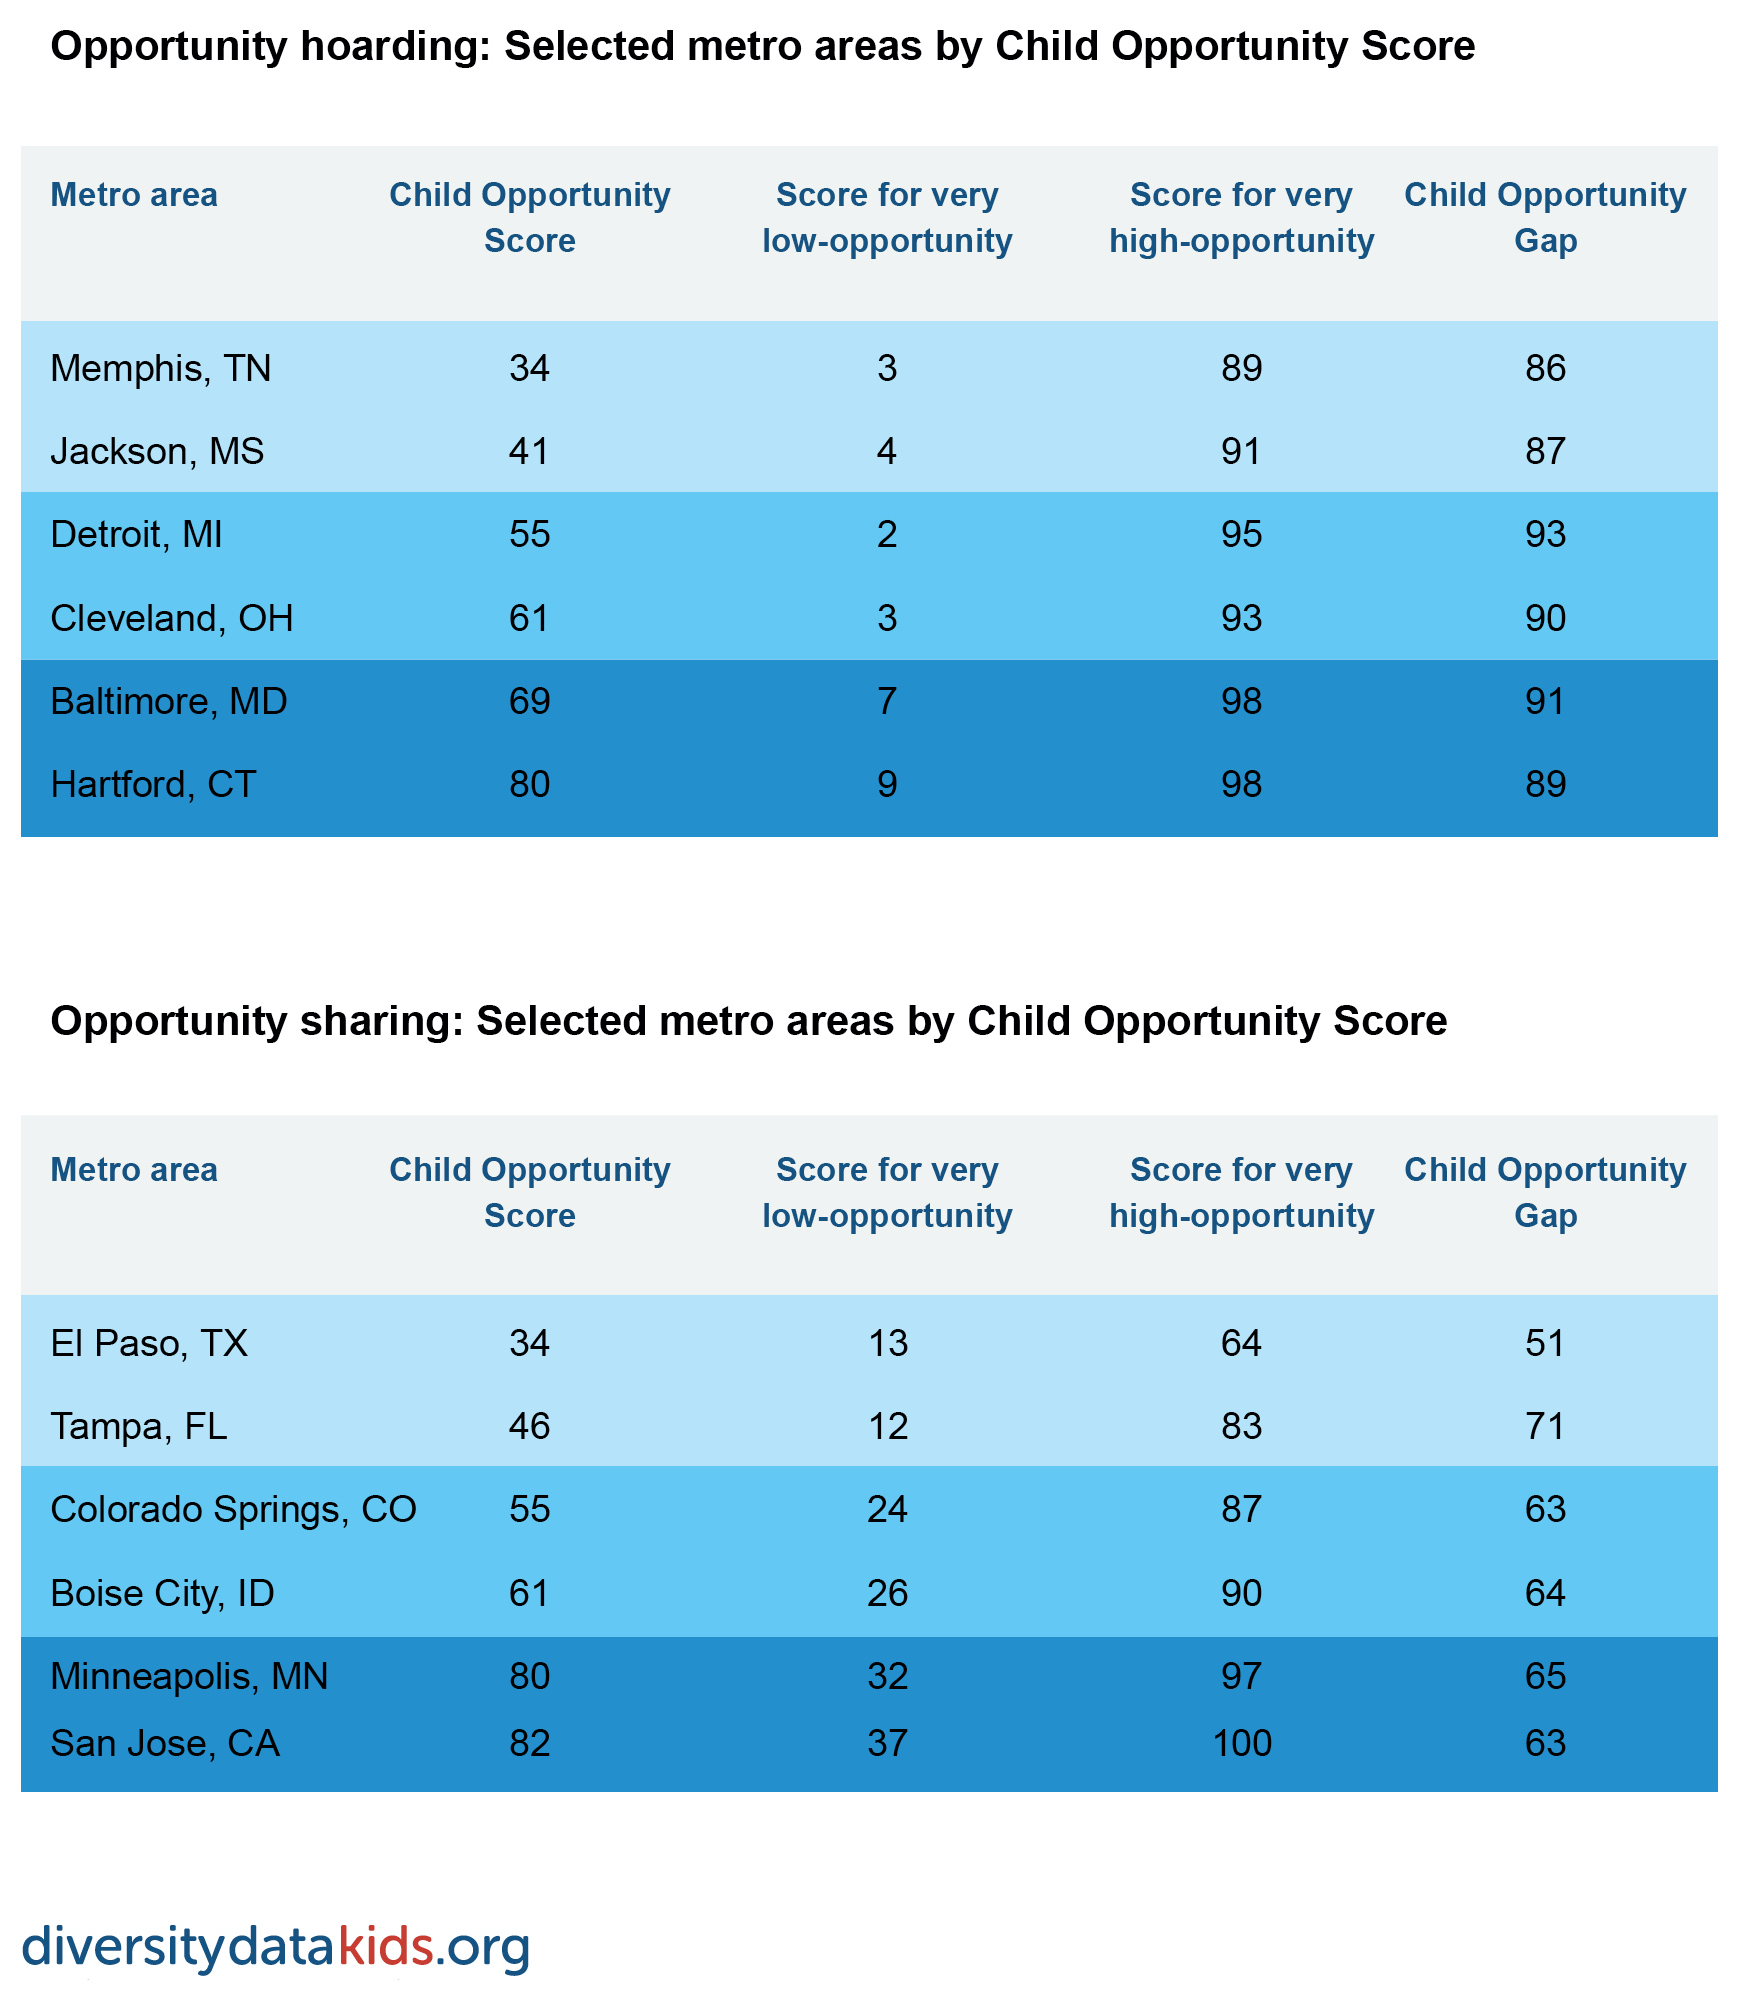
While opportunity gaps exist across all metros, their magnitude varies. We divide metros into three equal groups based on their overall opportunity measured by their Child Opportunity Score (low, medium, high). Within each group, we characterize metros with wide Child Opportunity Gaps as areas of opportunity hoarding: areas where lower opportunity neighborhoods have much worse conditions—inexperienced teachers, higher poverty, more vacant buildings, less green space—than higher opportunity ones. We characterize areas with narrow Child Opportunity Gaps as areas of opportunity sharing: areas where the difference in conditions between lower and higher opportunity neighborhoods is much smaller.
The tables below shows examples of hoarding and sharing metros with different overall child opportunity (low=light blue, medium=medium blue, or high=dark blue).
While wide Child Opportunity Gaps signal inequities in children’s neighborhood environments everywhere, they are especially troubling in metro areas with overall high levels of child opportunity (high Child Opportunity Scores). Both Hartford, CT, and Minneapolis, MN have a Child Opportunity Score of 80, indicating very high overall opportunity.
However, they have vastly different Child Opportunity Gaps: 89 in Hartford and in 65 Minneapolis. This difference is driven by very low-opportunity neighborhoods in Hartford being left behind, despite their metro’s overall high opportunity. While very low-opportunity neighborhoods in Hartford have a score of 9, very low-opportunity neighborhoods in Minneapolis have a score of 32.
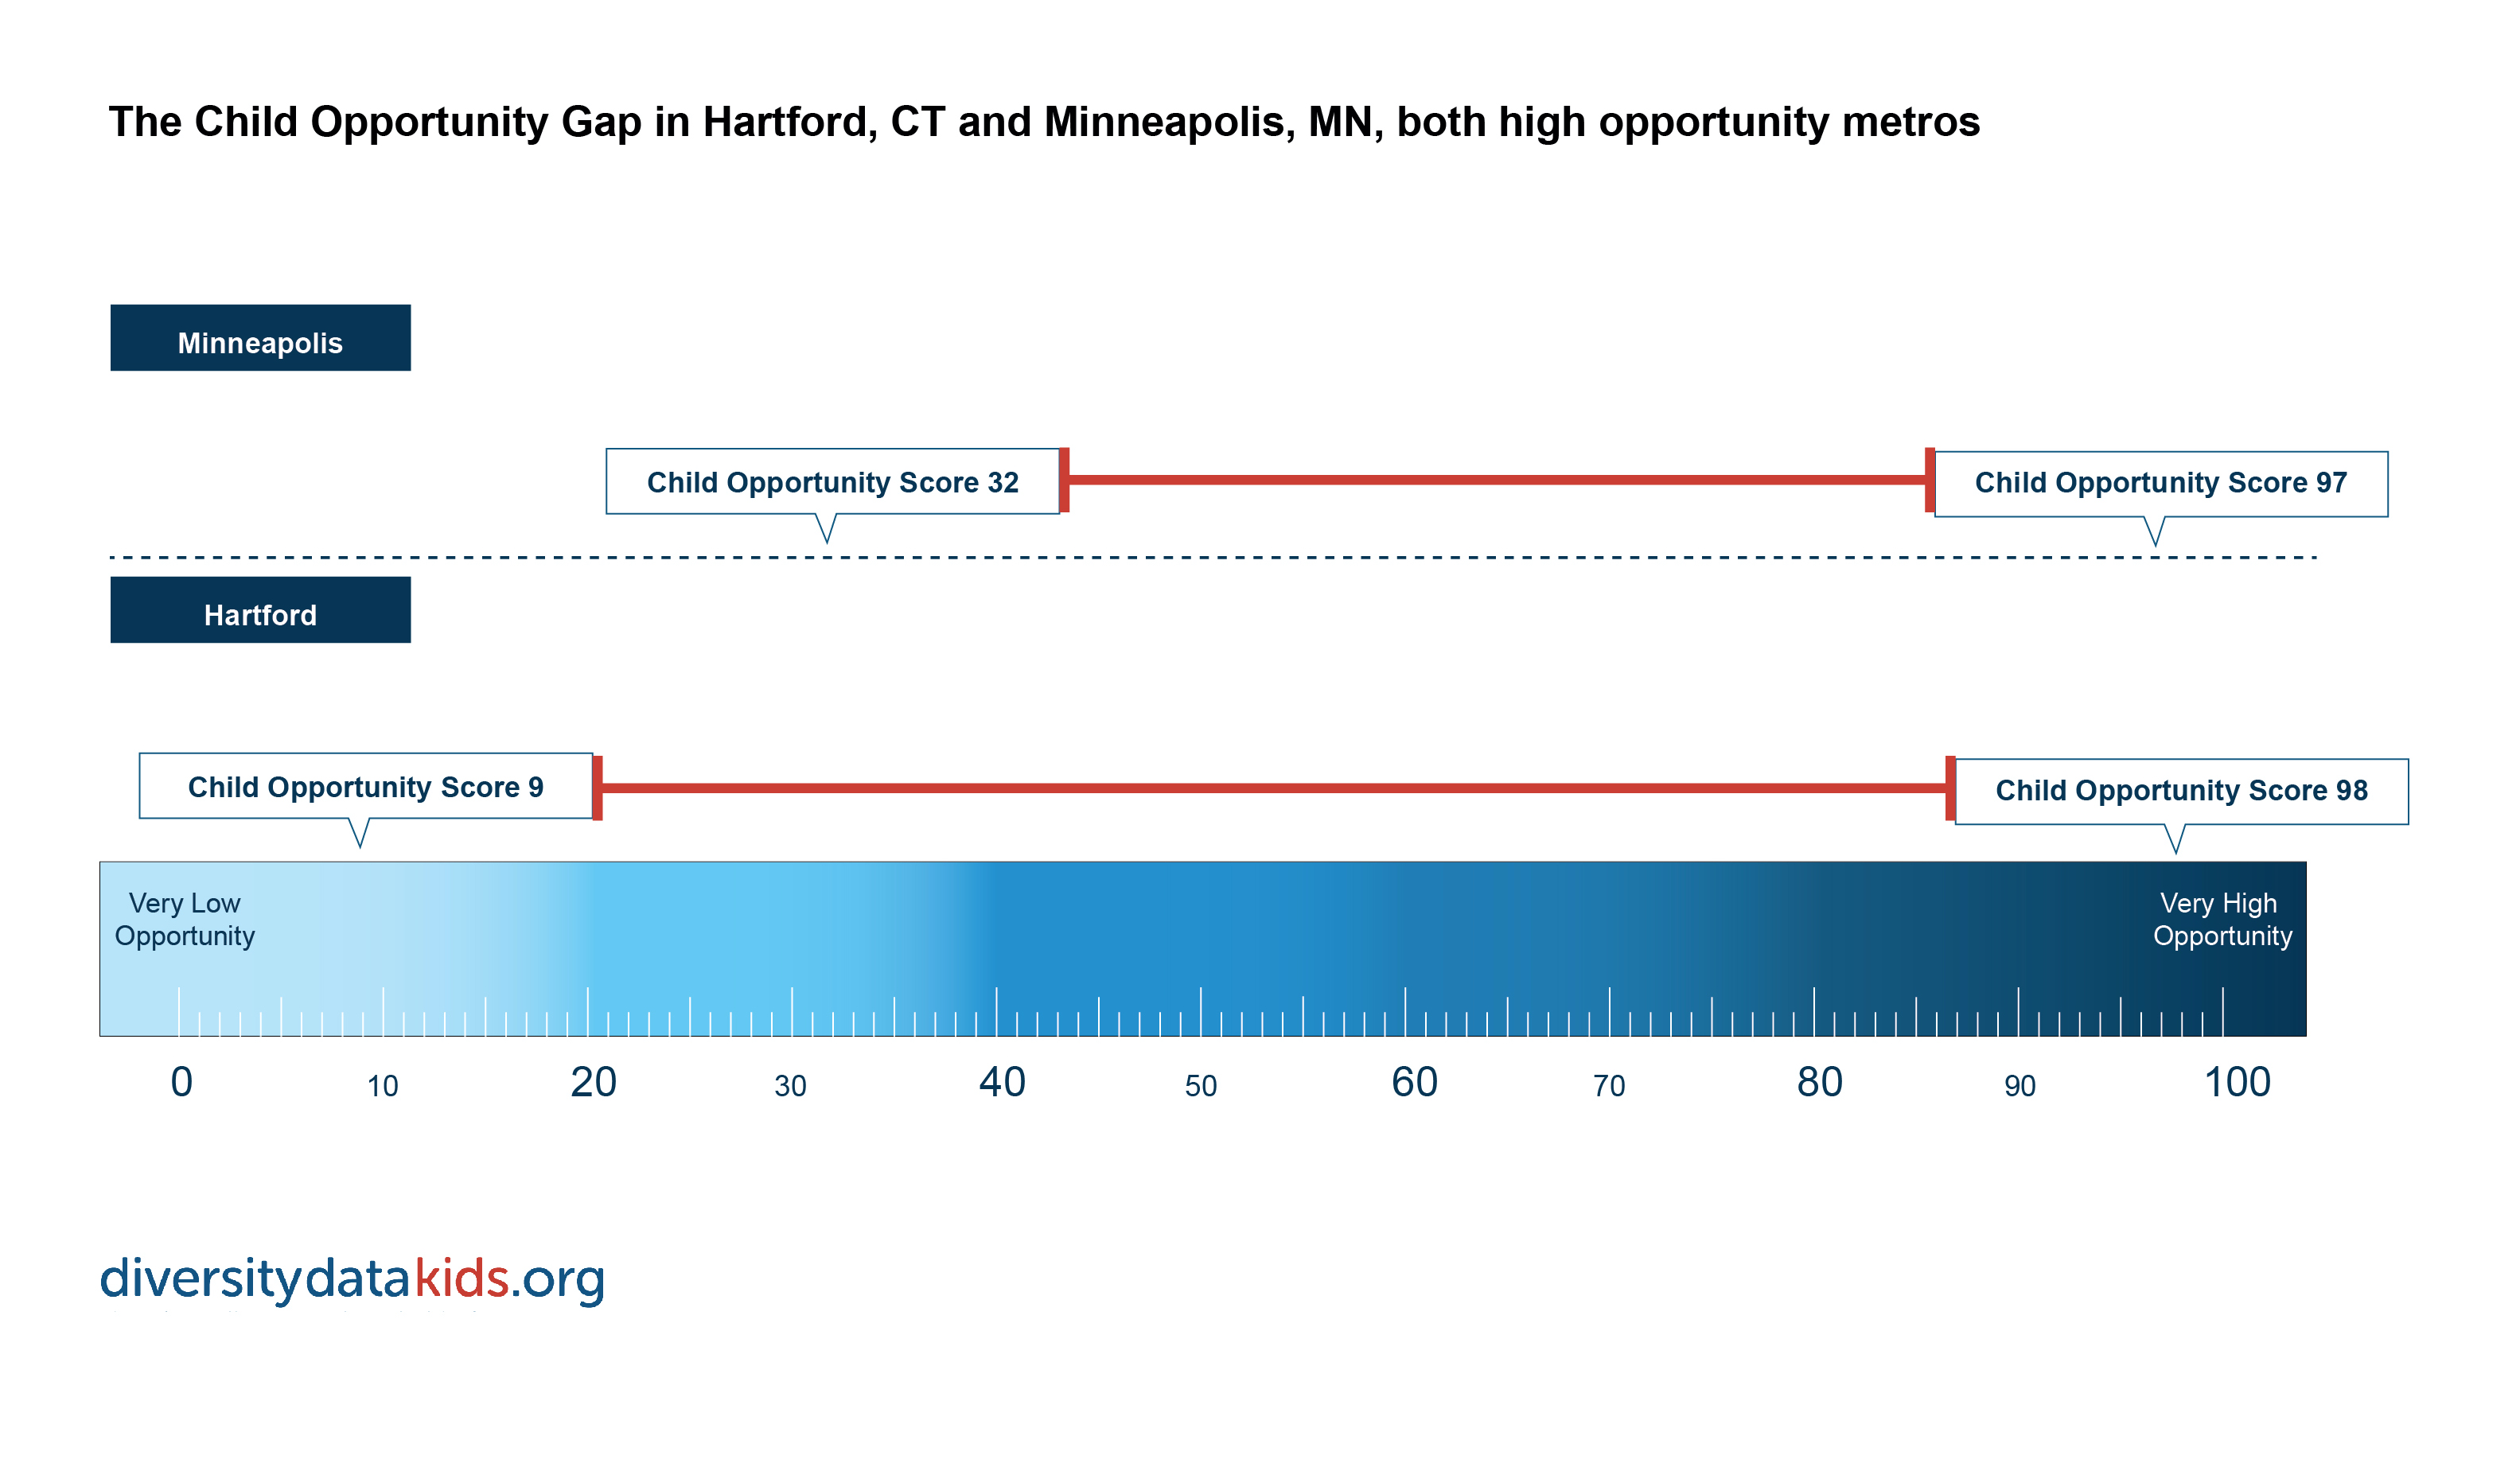
We characterize a situation like Hartford’s as opportunity hoarding and a situation like Minneapolis as opportunity sharing.
A child growing up in a very low-opportunity neighborhood faces worse resources and conditions in Hartford than in Minneapolis. For example, in Hartford, a child in a very low-opportunity neighborhoods experiences a community with high economic vulnerability. In her neighborhood’s public schools, 86% of students need free or reduced-price lunch, while in a similar neighborhood in Minneapolis only 69% of children do. This is serious because attending schools with a high proportion of low-income students is linked to lower educational achievement.
Source: Child Opportunity Index 2.0 database, diversitydatakids.org.
Note: A data revision in June, 2020 has led to very small changes in datapoints/rankings for some individual metros. See the revisions and updates page for complete details.