Across the U.S. we see vast inequality in child neighborhood opportunityneighborhood opportunitywithin metropolitan areas. In a single metro, just a few miles apart, some children experience the best neighborhood conditions available to any child in the U.S., while others experience the worst conditions.
Not all metros are the same though. Some have higher overall opportunity than others. And some are more unequal than others.
We measure the overall opportunity in a metro according to the typical value of the Child Opportunity Index (COI) across all of its neighborhoods. The COI is an aggregate measure of 29 neighborhood indicators important for child wellbeing and ranges from 1 (lowest opportunity) to 100 (highest opportunity). We then rank and classify metros into three equal groups (low-, medium-, and high-opportunity). For example, El Paso has low overall opportunity (35) while Chicago has medium overall opportunity (57) and Boston has high overall opportunity (78).
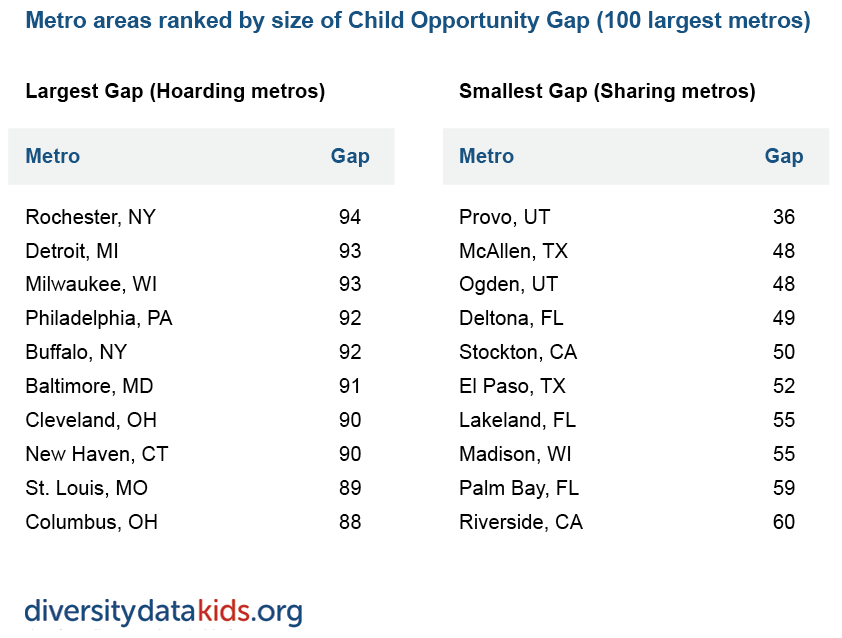
Metros also differ in the extent of inequality between their neighborhoods, which we measure with the Child Opportunity Gap: the difference within a given metro between the Child Opportunity Score of its 20% highest opportunity neighborhoods and its 20% lowest opportunity neighborhoods.
In some metros, there is a very large gap (equal to or higher than 80 points) between their highest and lowest opportunity neighborhoods. In these metros, which we call hoarding metros, the gap is at least as large as the gap between the highest and lowest opportunity neighborhoods across the entire country. These are places characterized by extremes: some children live in neighborhoods of concentrated affluence and opportunity, while others live in neighborhoods that have experienced disinvestment and neglect over generations, producing conditions of concentrated disadvantage.
As the chart below shows, children who live in low-opportunity neighborhoods in hoarding metros experience much worse conditions on many dimensions of child opportunity: the schools they attend have school-poverty rates more than four times higher than in high-opportunity neighborhoods. More than half of the surface area (51%) is made up of impervious surface such as rooftops, roads or parking lots, compared with just 21% of the surfaces in very high-opportunity neighborhoods. This means that children living in very low-opportunity neighborhoods lack access to parks, playgrounds and other green spaces. And very low-opportunity neighborhoods have a housing vacancy rate 3.5 times as high as the rate in very high-opportunity neighborhoods (high vacancy rates make neighborhoods less safe and reduce home values and family wealth). Living in very low-opportunity neighborhoods poses significant burdens on children and reduces their chances to have a healthy childhood and live up to their full potential. In contrast, children living in very high-opportunity neighborhoods have better conditions to thrive and grow into their full potential. While there is always a difference between the conditions in very high- and very low-opportunity neighborhoods, this difference is very large in hoarding metros—considerably larger than in sharing metros.
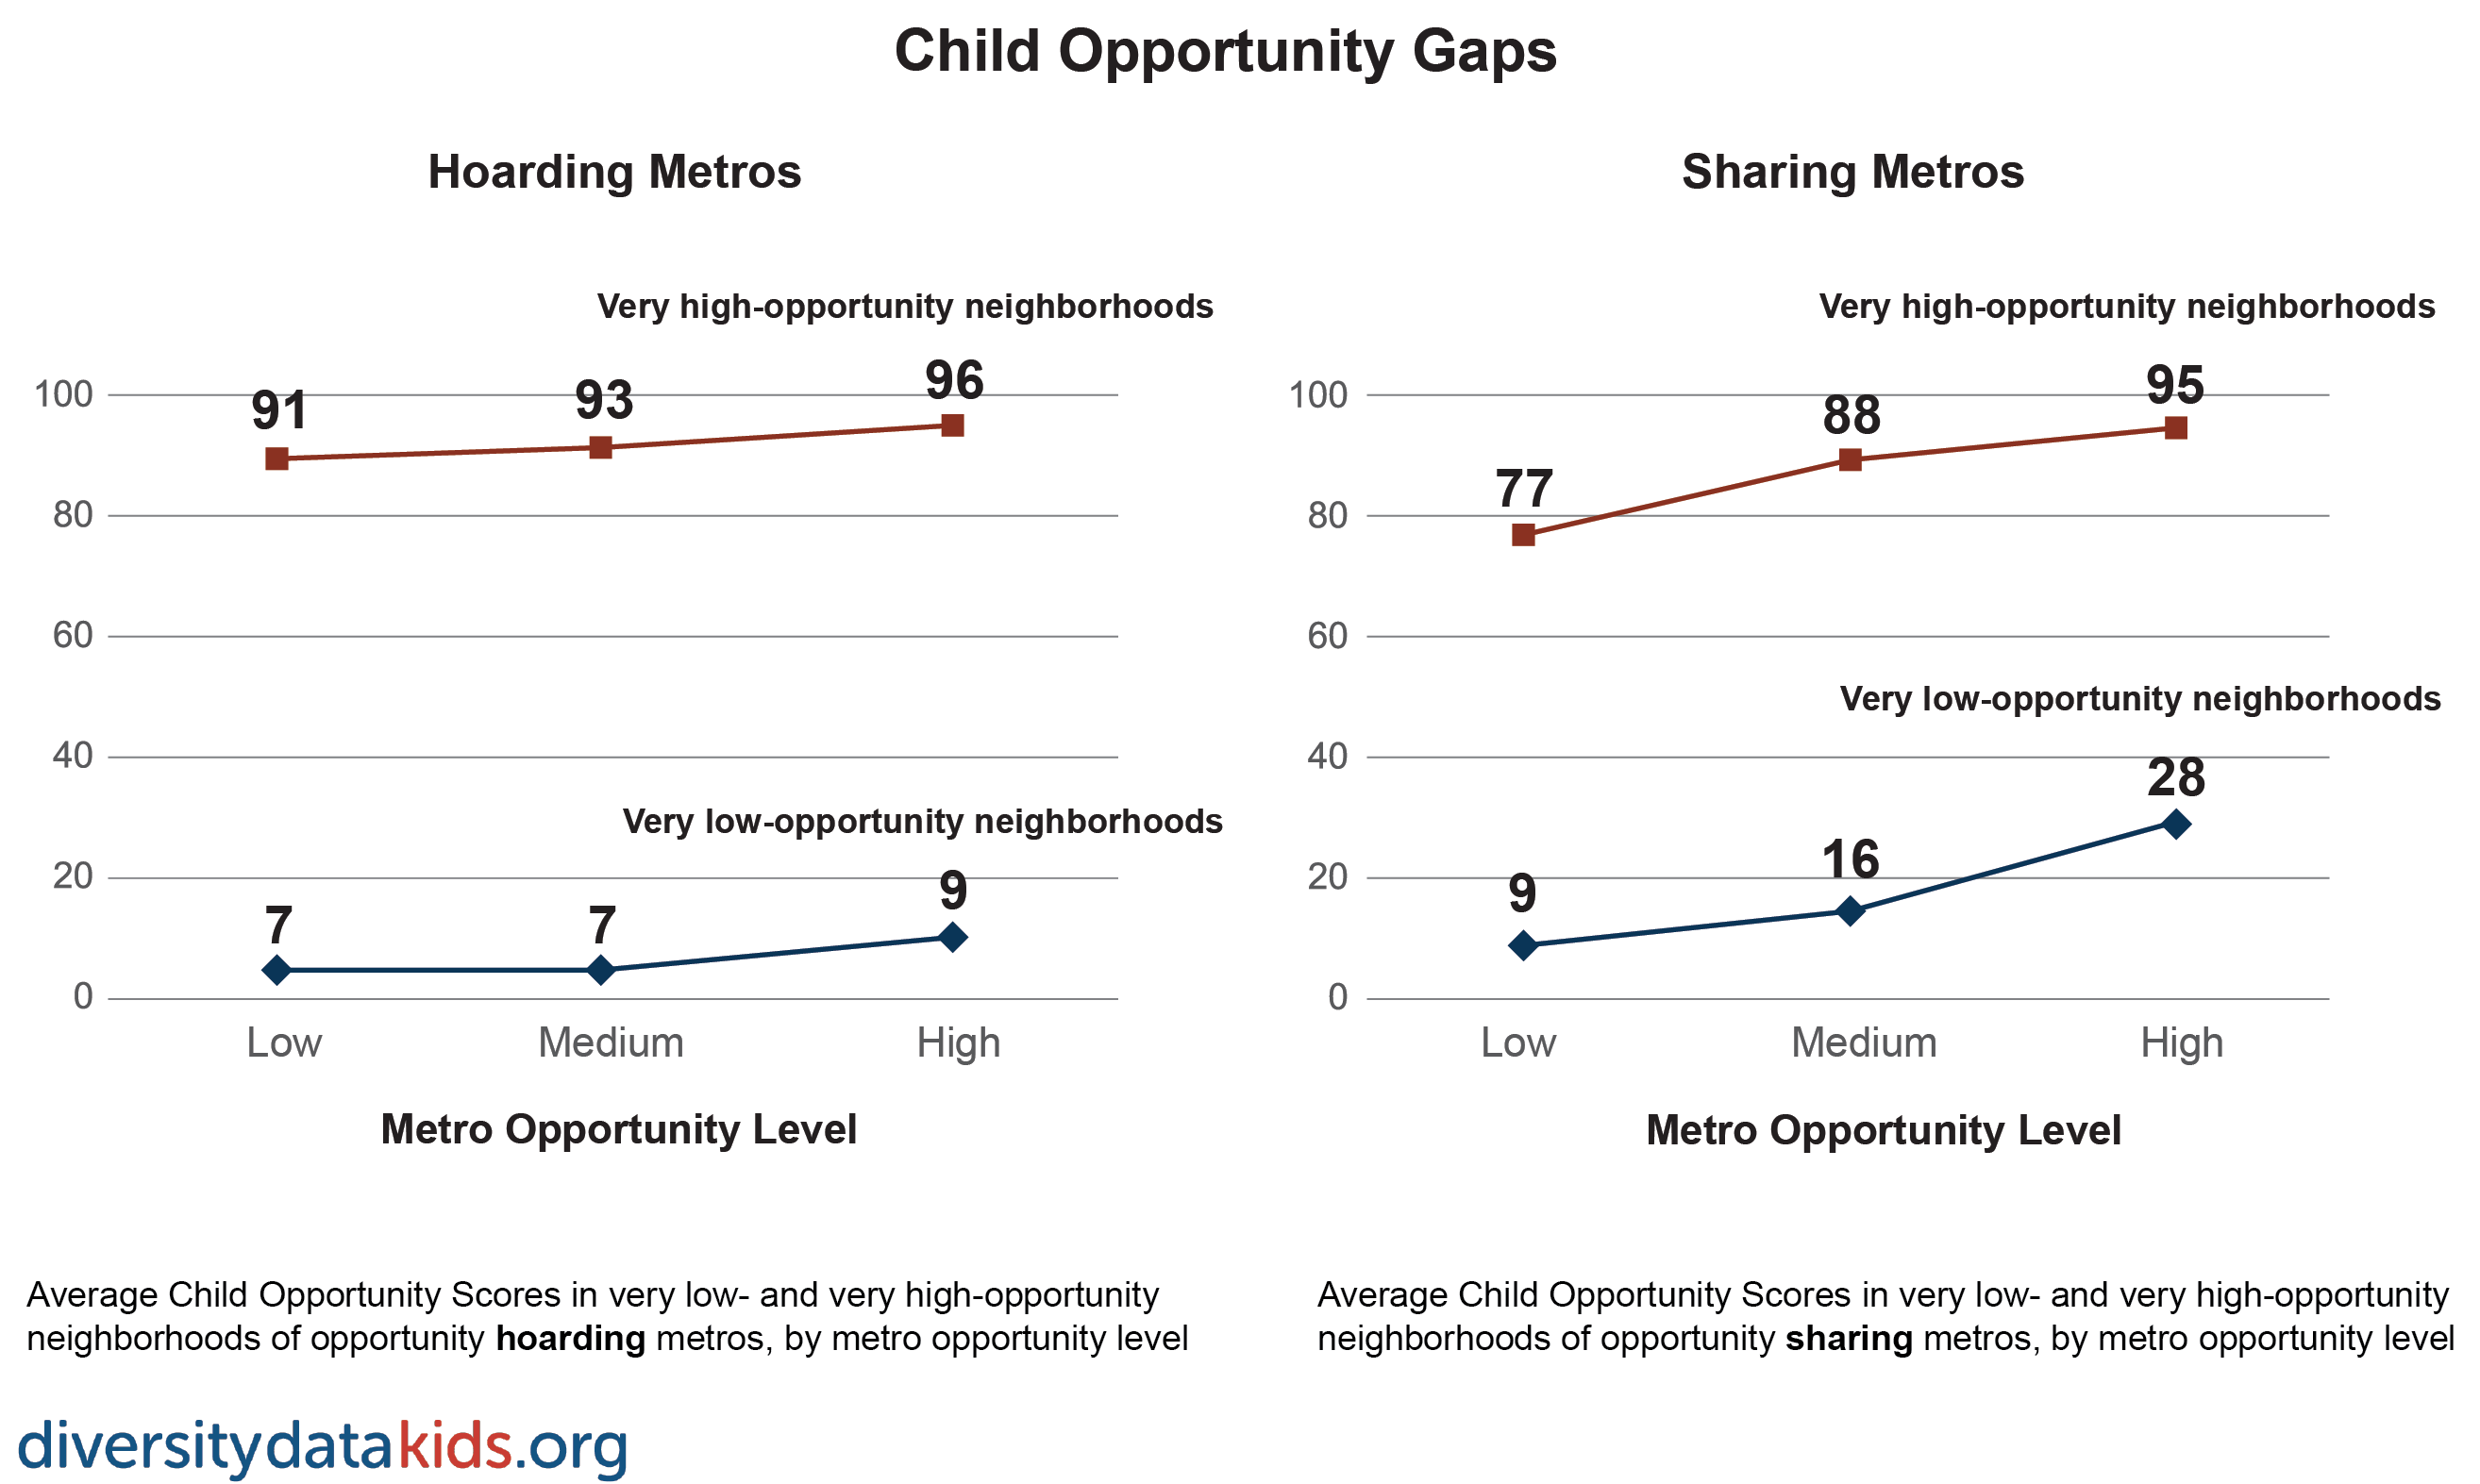
We would hope that higher overall opportunity in a metro would lift up opportunity in all of its neighborhoods. However, in hoarding metros, very low-opportunity neighborhoods still have very poor conditions (and low Child Opportunity Scores), regardless of the overall opportunity level of the metro. Very low-opportunity neighborhoods in hoarding metros have scores close to the “opportunity floor” for the entire country, and the scores do not improve when the overall opportunity of the metro increases. In hoarding metros, very low-opportunity neighborhoods are left behind.
In contrast, in metros with a smaller Child Opportunity Gap (<80 points), a higher overall level of opportunity in the metro does lift up its very low-opportunity neighborhoods. The conditions in these neighborhoods improve with higher overall opportunity in the metro. Very low-opportunity neighborhoods share in the increased overall prosperity of a metro.
At the other end of the opportunity range, in metros with medium and high overall opportunity, very high-opportunity neighborhoods do almost equally well in hoarding and sharing metros.
The graphs below illustrate these patterns: In hoarding metros, neighborhood opportunity levels remain relatively flat even as overall levels of opportunity in a metro rise. In sharing metros, very low- and very high-opportunity neighborhoods rise in tandem.
Opportunity hoarding hurts Black and Hispanic children most
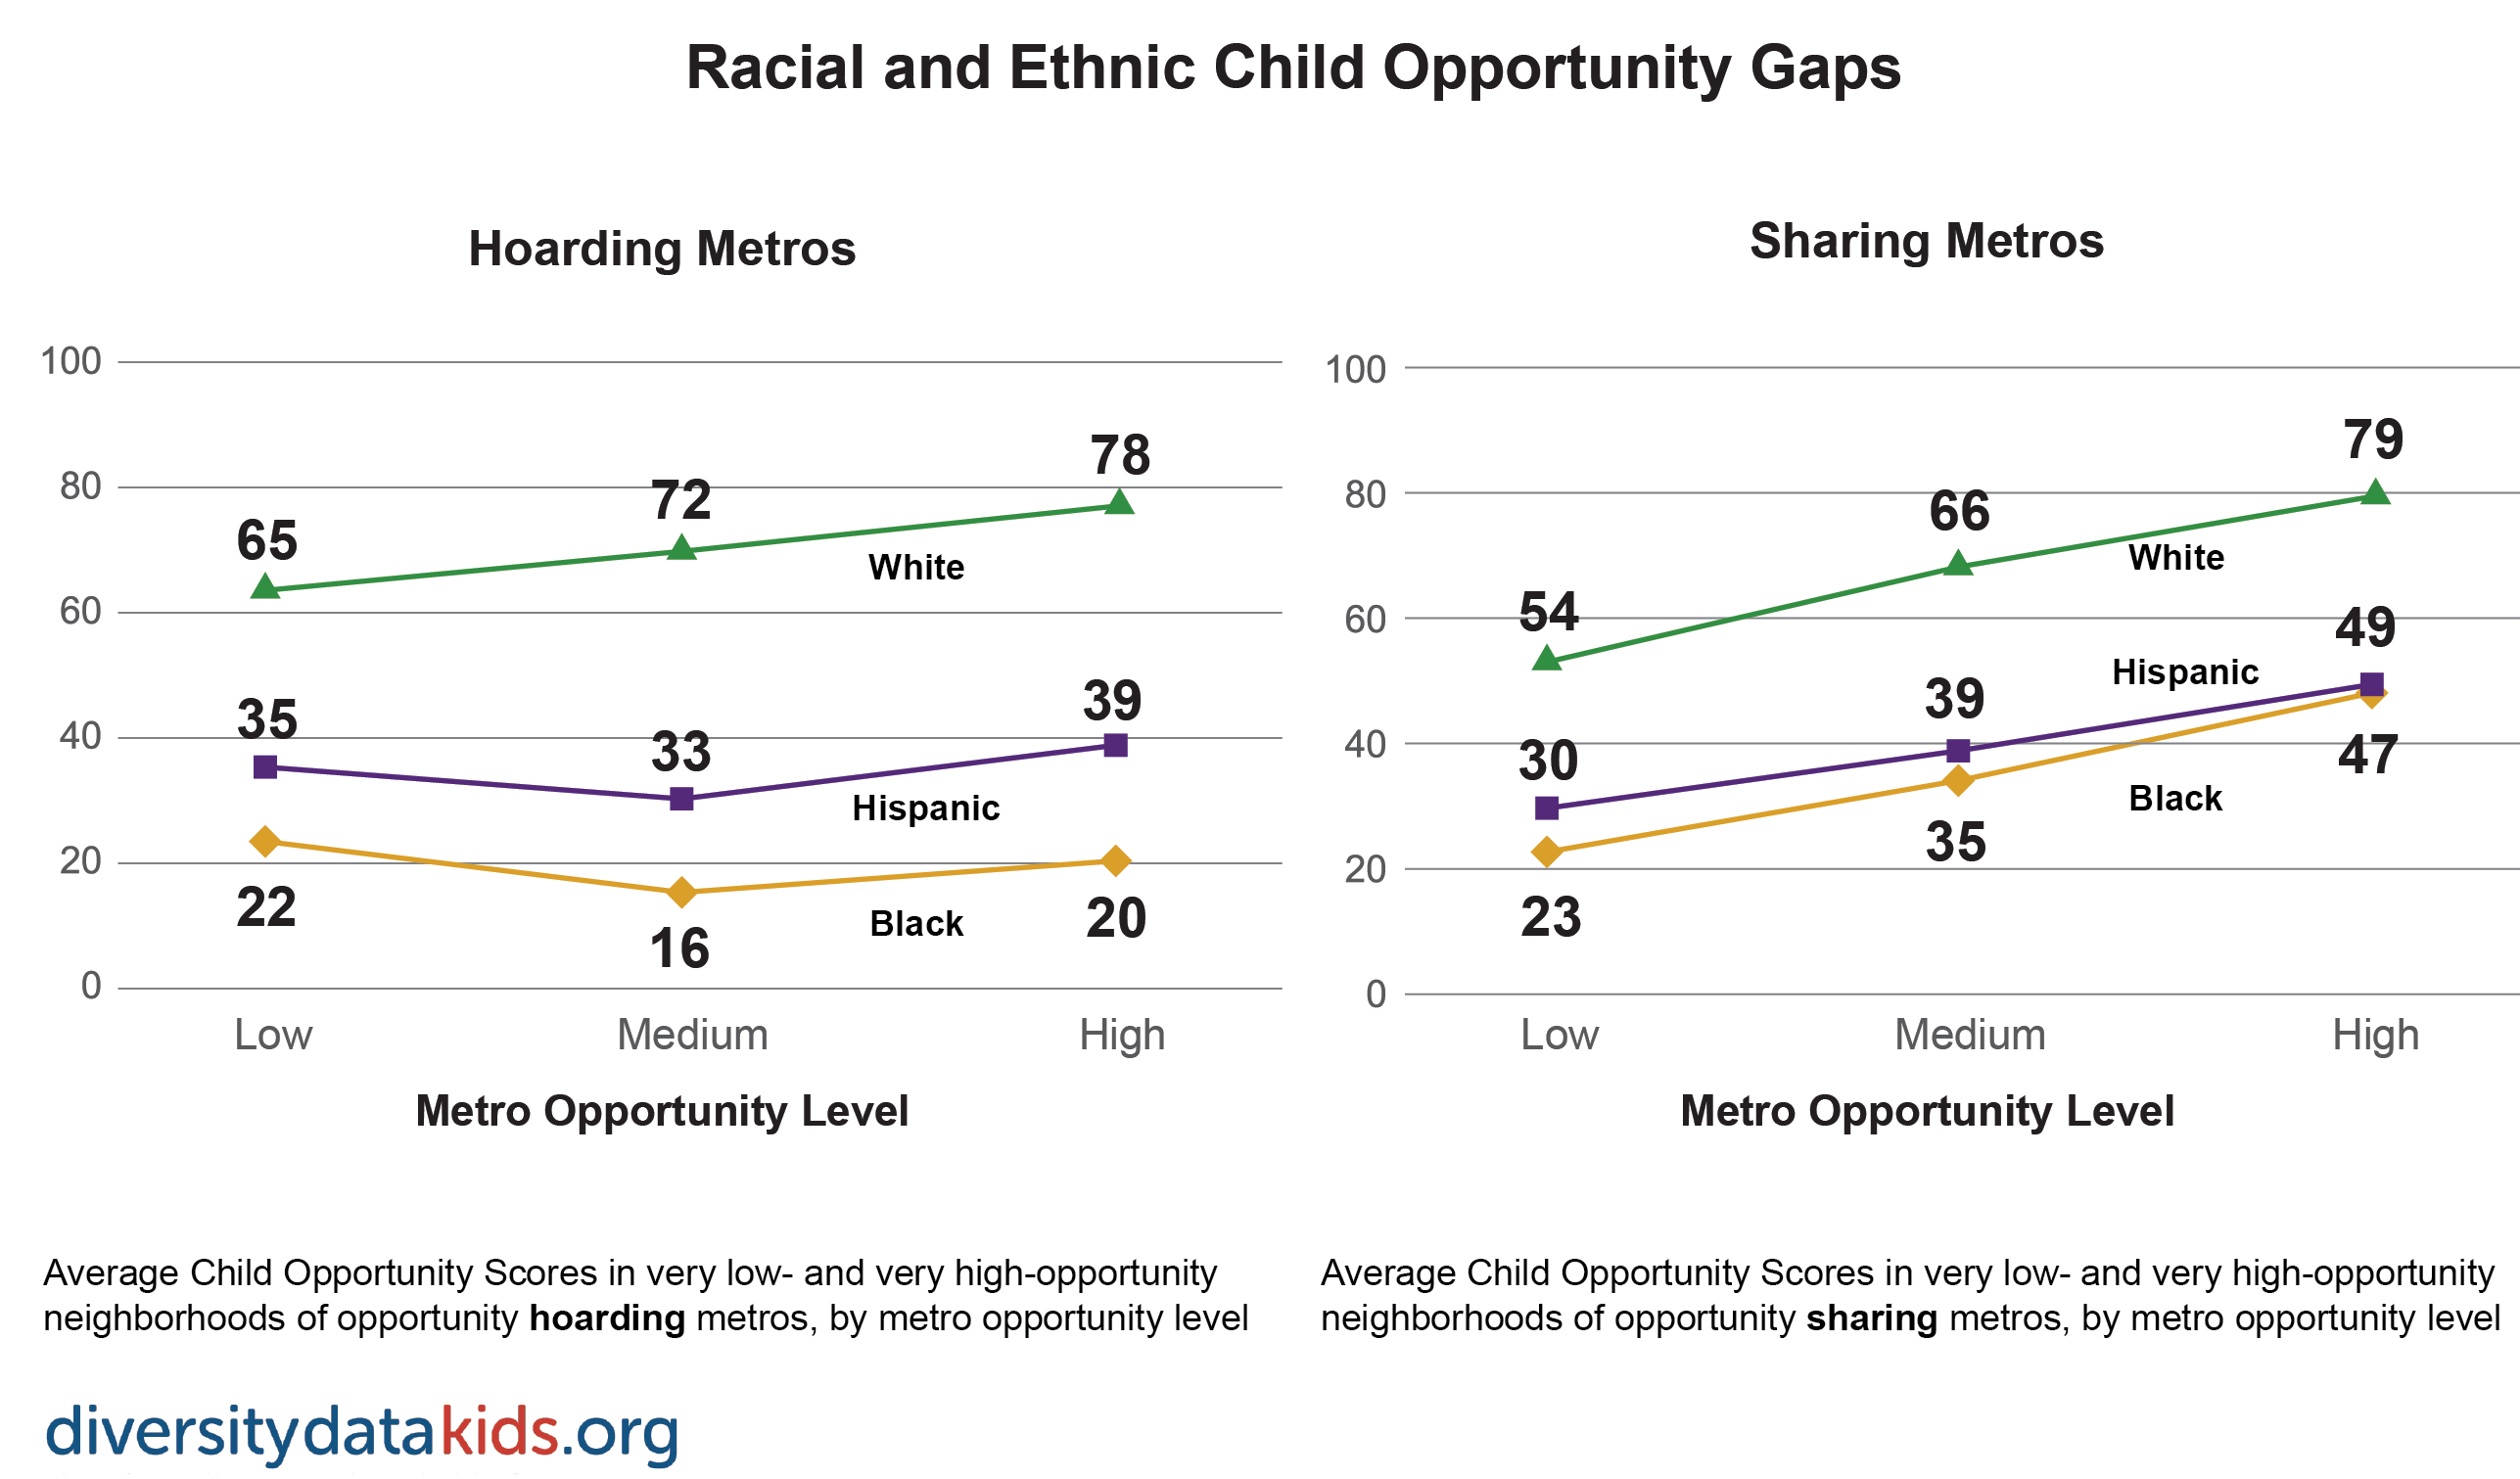
Opportunity hoarding hurts all children living in the lowest opportunity neighborhoods, but it disproportionally hurts Black and Hispanic children. Metros with larger Child Opportunity Gaps have larger gaps between the neighborhoods that White children experience and the neighborhoods that Black and Hispanic children experience. While there are racial/ethnic inequities in child neighborhood opportunity in practically all metros, these inequities are much larger in hoarding metros.
As shown in the graphs below, the gap between the opportunity scores for Black and White children ranges from over 40 points in low-opportunity hoarding metros to almost 60 points in high-opportunity hoarding metros. In contrast, in sharing metros the Black/White opportunity gap is about 30 points regardless of the overall opportunity in the metro. The Black/White gap is lower in sharing metros than in hoarding metros. Also, in sharing metros, higher overall opportunity lifts the neighborhood opportunity scores of both Black and White children, while in hoarding metros, higher overall opportunity in the metro only improves the neighborhood scores of White children, while the scores of Black children are flat. The patterns are similar for the Hispanic/White gap.
While policy and research discussions often focus on concentrated disadvantage or concentrated poverty, our analysis of the Child Opportunity Gap calls attention to the problem of concentrated affluence and inequality between neighborhoods. Very low-opportunity neighborhoods have conditions that are challenging for children, but extreme inequality between very high- and very low-opportunity neighborhoods is also a serious problem: "'Segregation makes privilege doubly invisible to the privileged’ by keeping advantage out of sight and normalizing advantage."
Like concentrated disadvantage, concentrated affluence is a result of policy choices around zoning regulations, school funding and mechanisms for financing home ownership. Identifying hoarding and concentrated affluence as a problem is essential to any effort to consider policy solutions to racial/ethnic inequity in the distribution of children’s neighborhood opportunity.
As we grapple with the stark geographically-based racial and ethnic inequities exposed by COVID-19 and face a long overdue reckoning with the long history of institutional racism in the U.S., sharing metros are a promising site for further research. With their smaller Child Opportunity Gaps and proportionally smaller racial opportunity gaps, sharing metros could be a starting place to identify policy and other choices that might reduce inequity and help move the U.S. closer to the ideal of equal opportunity for all children.
How does your metro stack up?
Use this interactive dashboard to visualize the racial and ethnic dimensions of opportunity hoarding and sharing in your metro.
If the graph is grayed out, please reload the page.
Source: Child Opportunity Index 2.0 database, diversitydatakids.org.